 High-speed rail as a strategic infrastructure: a review of the EU’s high-speed rail vision within the TEN-T framework
  Dissent at the centre: protest policing in the EU’s capital
  Unpacking the Global Gateway’s Financial Structure: A Critical Look at its Development Logic
  2026 Corporate Sustainability Due Diligence Directive – The amendment process and its impact
Part of the column ‘The European Green Deal Explained: The EU’s attempts to save the Climate’
Written by Joran Buwalda
In the previous column, we looked at the three main instruments that the EU uses to reduce emissions. We will now dive deeper into one of those, the emissions reduction targets. In this column, you will learn how targets can fool you. Here’s the fooling: the EU achieved its 2020 target of 20% emissions reductions ahead of schedule (in 2018 the EU was already at 23% reduction) (European Commission, 2018). However, between 2014 and 2017, emissions have been on the rise (Eurostat, 2020). How is it possible that the EU achieved a reduction target with increasing emissions?
To understand this, we will dive into the numbers. Emissions reduction targets prescribe a decrease in emissions compared to a specific year. For instance, the current target for the EU is that emissions must be 20% less in 2020 than in 1990 (European Commission, 2018). At first sight, this target looks unambiguous: in 2020, the EU can only emit ⅕ of what it emitted in 1990. However, the target only specifies the end result. It conceals whatever happened between 1990 and 2020. Fortunately, the EU keeps track of its emissions and puts them in graphs, such as figure 1. You can see that although emissions show a clear overall downward trend, there have been three periods of emissions increases: emissions rose between 1993 and 1996, between 2000 and 2004 and between 2014 and 2017 (Eurostat, 2020).
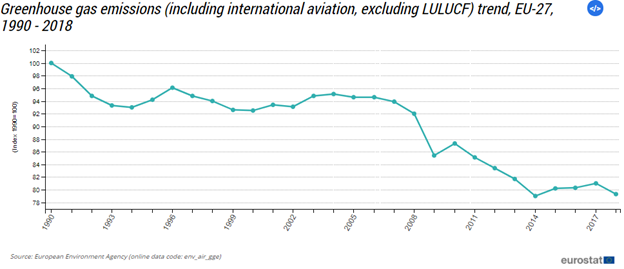
Figure 1 (Eurostat, 2020)
So, why does the EU have a target that allows for temporary increases? Moreover, why is 1990 the starting point? Why not compare to 2000, a much more round number? If you’re not dazzled by the numbers yet; here is one final statistic to chew on. Remember how the EU was already at 23% reduction in 2018? If we compare the emissions in 2018 to 1993 instead of 1990, the EU would have reduced only roughly 15% (about one third less reduction!). What’s going on here?
The trick is in the choice of the base-year, that “1990” that turns up everywhere. Having 1990 as a base-year was a strategic political choice that originated from the Kyoto Protocol, the world-wide agreement that preceded the Paris Agreement. In the early 1990’s, Europe was plagued by an economic recession, partly due to the fall of the Soviet Union. During that recession, emissions naturally decreased (see Figure 1 above). Choosing 1990 as base-year therefore allowed for bigger reported emission decreases (Morel & Shishlov, 2014). Emissions also fell sharply during the 2008 recession. Before 2008, the EU was lagging behind on her 2020 emission reduction target. After the 2008 recession, the EU was so far ahead of schedule, that the EU could afford an increase in emissions between 2014 and 2017 without threatening the emission reduction target (Eurostat, 2020).
However, the EU is not alone in applying this base-year trick. Figure 2 below shows how expected emission reductions by 2030 differ when compared to different base-years. The EU is expected to reduce a bigger share of emissions relative to 1990 than for example relative to 2005 or 2013. Therefore, the EU strategically chose 1990 as base-year for its main emission reduction targets so it could report larger emissions reductions. The same holds for Canada and the US, which can report the biggest emissions with 2005 as a base-year and for Japan, which chose 2013 as base-year (Damassa, 2015).
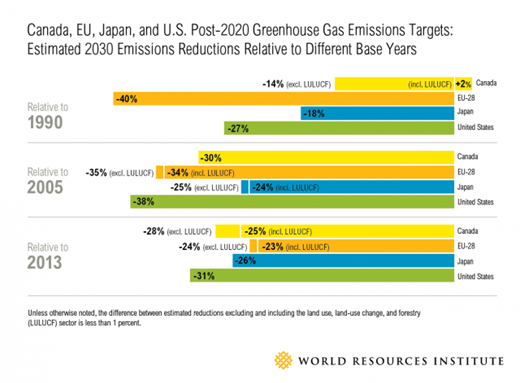
Figure 2 (Damassa, 2017)
Altogether, targets provide a clear and simple goal for emissions reductions, and they allow for flexibility. However, the base-year trick allows countries and the EU to present their emissions reduction targets to their own advantage and the target conceals temporary increases in emissions. Therefore, the true efforts on the front of emission reductions can only be evaluated when you look at what happened between the base-year and the target year.
Now that we understand how emissions reduction targets work, what can we say about future emission reductions? As part of her Green deal, the European Commission recently proposed to change the target for 2030 from 40% to 55% emissions reduction (European Commission, 2020). This is an ambitious step. However, the target is again compared to 1990. Moreover, the economic crisis caused by the Coronavirus pandemic could have the same effect as the crises in the 1990’s and in 2008. History has taught us that emissions often increase after a crisis, and a long-term target that only specifies the end-goal does nothing to stop that. Finally, remember the second instrument of the EU to reduce emissions, the Emission Trading System (ETS)? The carbon price in the ETS will likely drop as less companies need a carbon allowance, making it cheaper to increase emissions after the crisis (Treptow, 2020). Fortunately, the Green deal proposes some improvements to the ETS to make it more effective – that is the topic of the next column in this series.
References
Damassa, T. (2017) Canada, EU, Japan and US Post-2020 GHG Emissions Targets: Estimated Emissions Reductions Relative to Different Base Years. World Resources Institute. Retrieved from https://www.wri.org/resources/charts-graphs/ghg-emissions-targets-base-years
European Commission (2020). State of the Union: Commission raises climate ambition and proposes 55% cut in emissions by 2030. Retrieved from: https://ec.europa.eu/commission/presscorner/detail/en/IP_20_1599
European Commission (2018). Progress made in cutting emissions. Retrieved from https://ec.europa.eu/clima/policies/strategies/progress_en
Eurostat (2020). Greenhouse Gas Emission Statistics – Emission Inventories. Eurostat. Retrieved from https://ec.europa.eu/eurostat/statistics-explained/index.php?title=Greenhouse_gas_emission_statistics_-_emission_inventories#Trends_in_greenhouse_gas_emissions
Eurostat (2020). Shedding light on energy in the EU – A guided tour of energy statistics. Eurostat. Retrieved from https://ec.europa.eu/eurostat/cache/infographs/energy/bloc-4a.html#:~:text=In%202017%2C%20EU%20GHG%20emissions,by%202030%20compared%20with%201990.
Morel, R. & Shishlov, I. (2014) Ex-Post Evaluation of the Kyoto Protocol: Four Key Lessons for the 2015 Paris Agreement. Climate Report N. 44: Research on the Economics of Climate Change. Retrieved from https://www.i4ce.org/wp-core/wp-content/uploads/2015/09/14-05-Climate-Report-n%C2%B044-Analysis-of-the-KP.pdf
Treptow, T. M. (2020). Impact of Corona Crisis on European Climate Change Policy. Wirtschaftsdienst (Hamburg, Germany: 1949), 100(5), 364-366.